

Entra ID's provisioning logs are the source of truth when a SCIM job decides to skip a user, errors out on a specific attribute, or queues retries. In practice, the portal UI shows one application at a time, paginates aggressively, and does not aggregate across applications. The JSON export covers ad-hoc analysis but not a recurring "are my SCIM jobs healthy?" view.
SCIM Radar is a hosted dashboard built on top of those logs. You export the provisioning logs from Entra as JSON, drop the file in the dashboard, and you get a single view across every SCIM connector: success and failure rates over time, error categories, sync timelines, per-user provisioning status, exports.
Try it at scimradar.clidsys.com. A demo mode on the upload page loads sample logs, no account required.
Dashboard
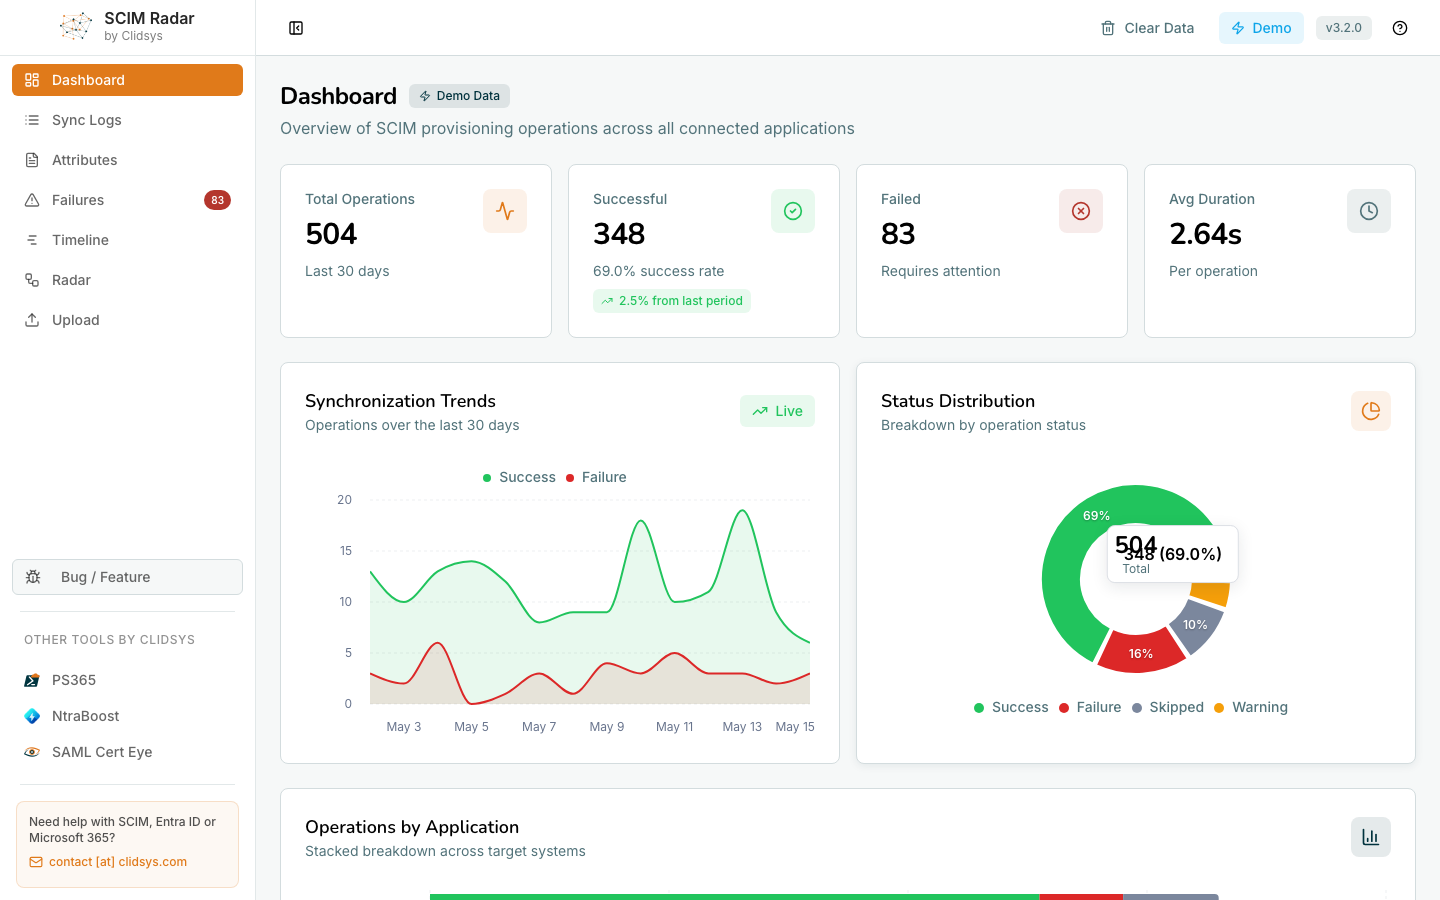
The Dashboard rolls up every operation in the loaded data into:
- Four headline KPIs: total operations, successful, failed, average duration per operation.
- Synchronization Trends chart: success and failure curves over the period.
- Status Distribution donut: Success / Failure / Skipped / Warning shares.
- Operations by Application: stacked breakdown so you can spot which connector is dragging the global success rate down.
- A "from last period" delta on the success rate to compare week over week.
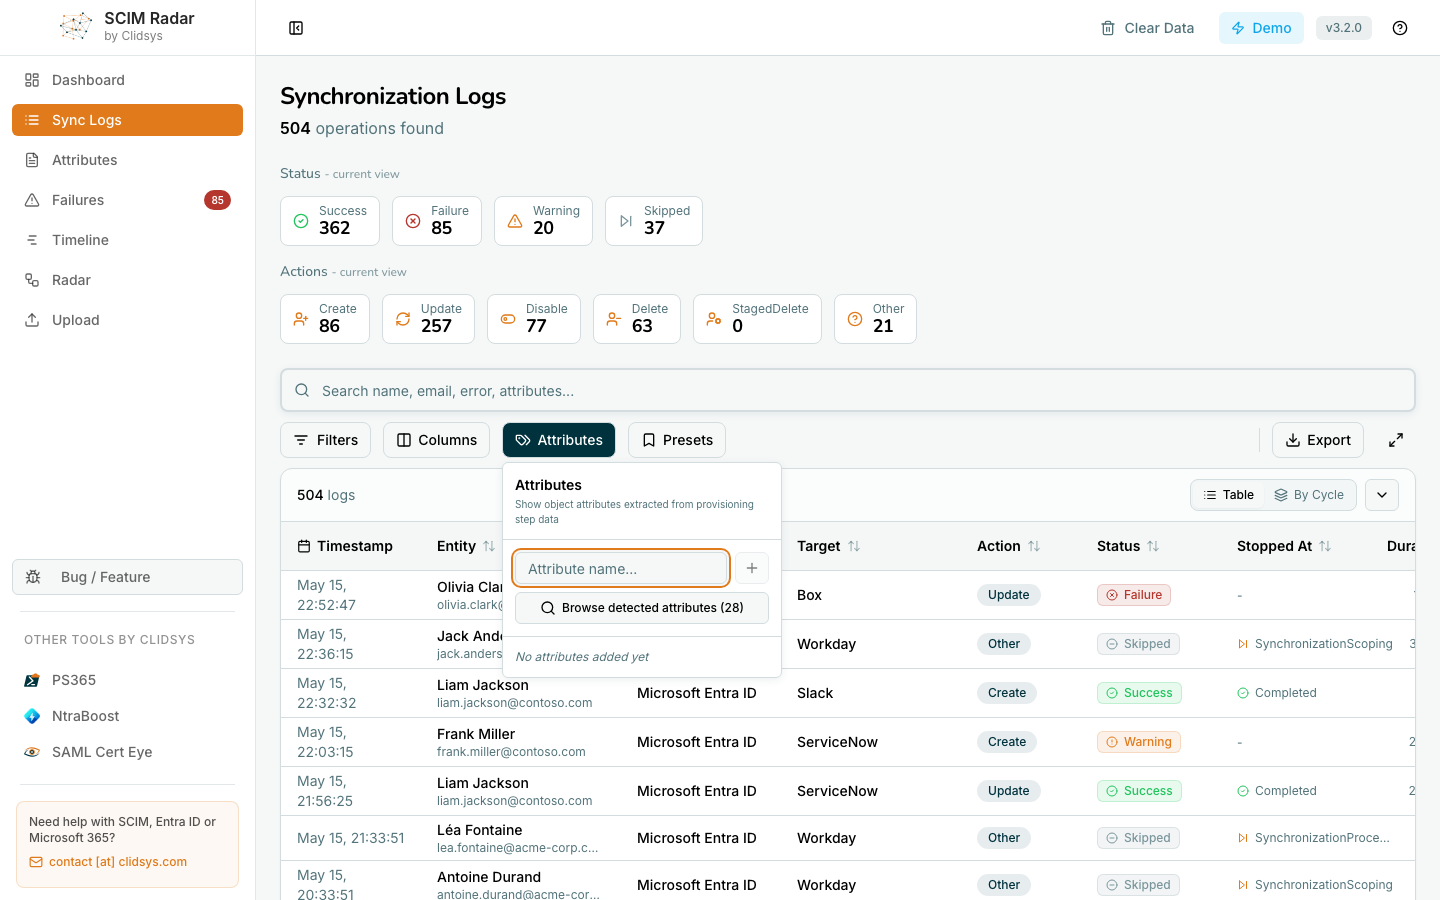
Sync Logs
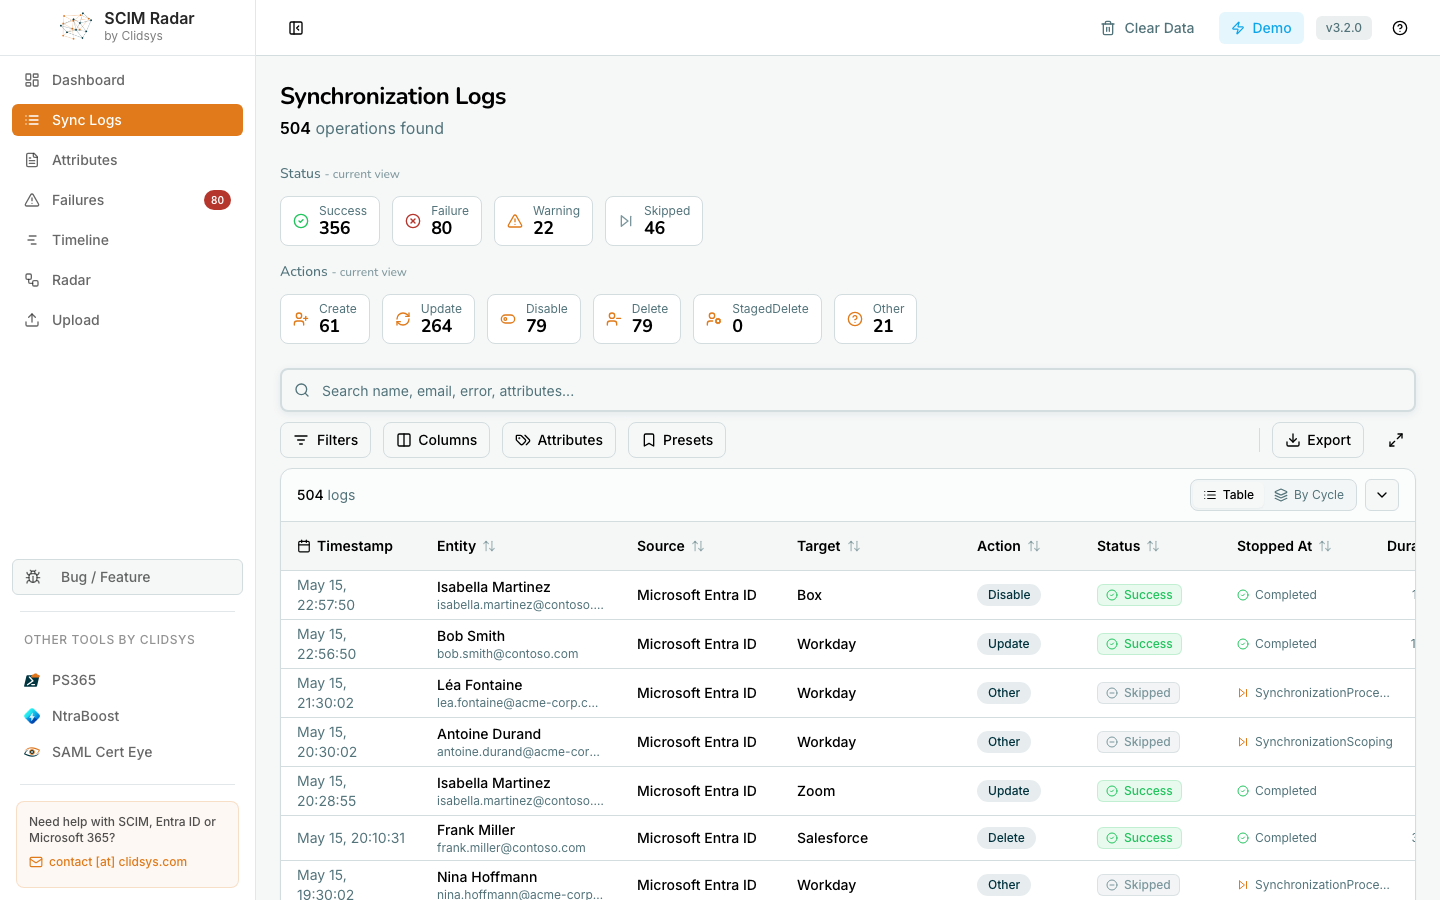
The master event list. Every provisioning operation across every connector, with timestamp, entity (user or group), source, target, action, status, completion time and duration. Status and Action chips up top double as one-click filters on the current view.
The toolbar exposes:
- Filters to scope the list by date range, source, target, status, action, etc.
- Columns to pick which built-in columns appear in the table.
- Attributes to surface any SCIM attribute as its own column so you can scan, sort and filter on it. Pick from the attributes detected in the loaded data, or type a name to add a custom one.
- Presets to save a combination of filters and custom attributes as a named preset, and apply it in one click later.
- Export to download the current filtered view as CSV or XLSX.
Attributes
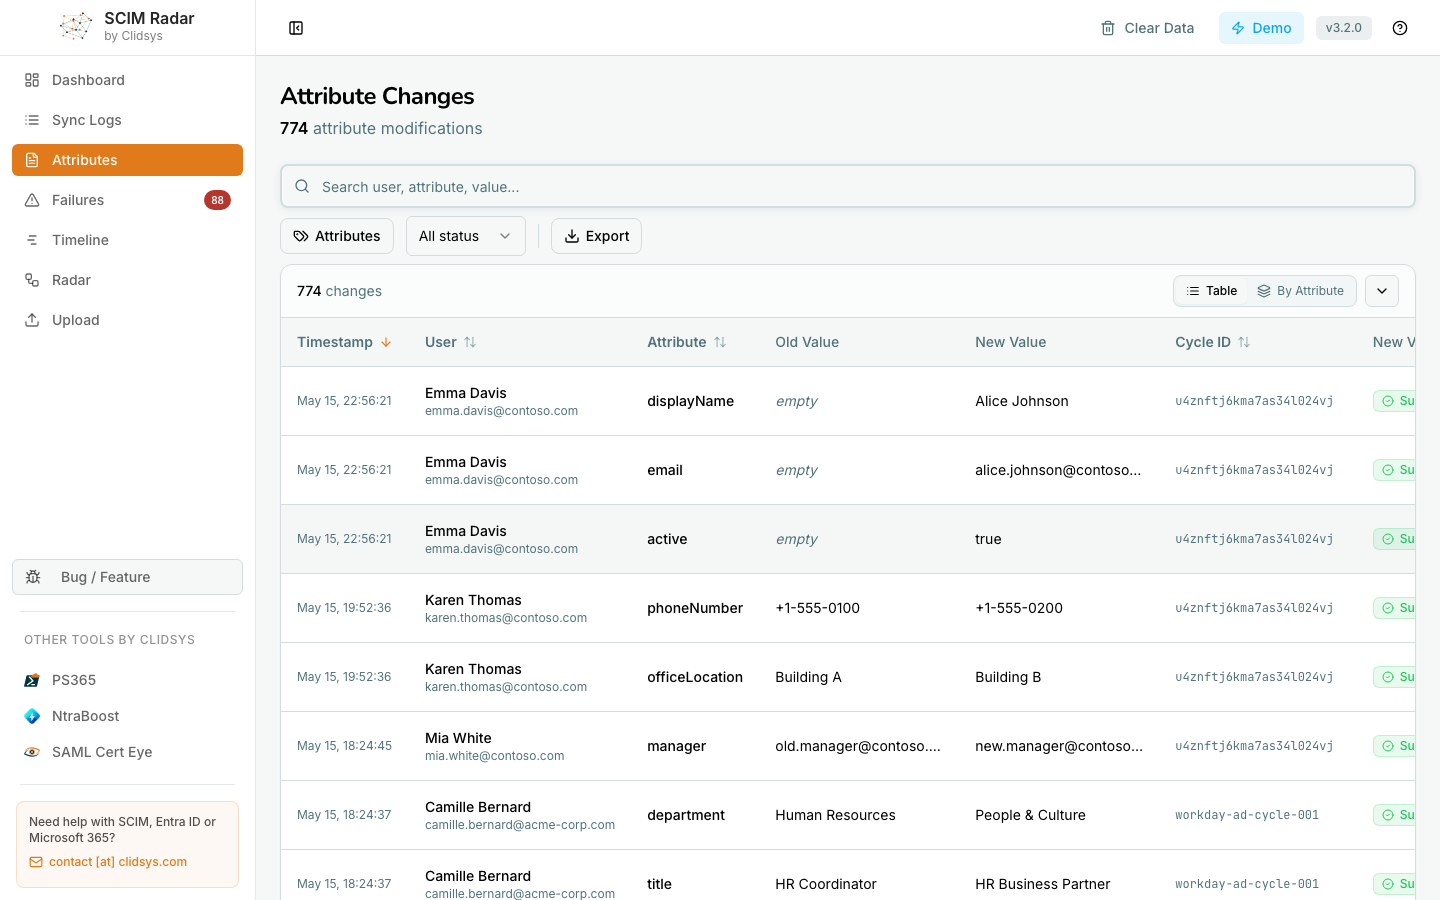
A flat ledger of every individual attribute modification: timestamp, user, attribute name, old value, new value, cycle ID and status.
In the screenshot above: displayName filled in for a brand-new account, email set from empty, active flipped to true, phoneNumber updated, manager changed after a transfer, department and title updated after a role change. Filter by attribute or by status to answer "show me every account that had manager set this week" or "every email change that failed". Export to CSV or XLSX is available.
Failures
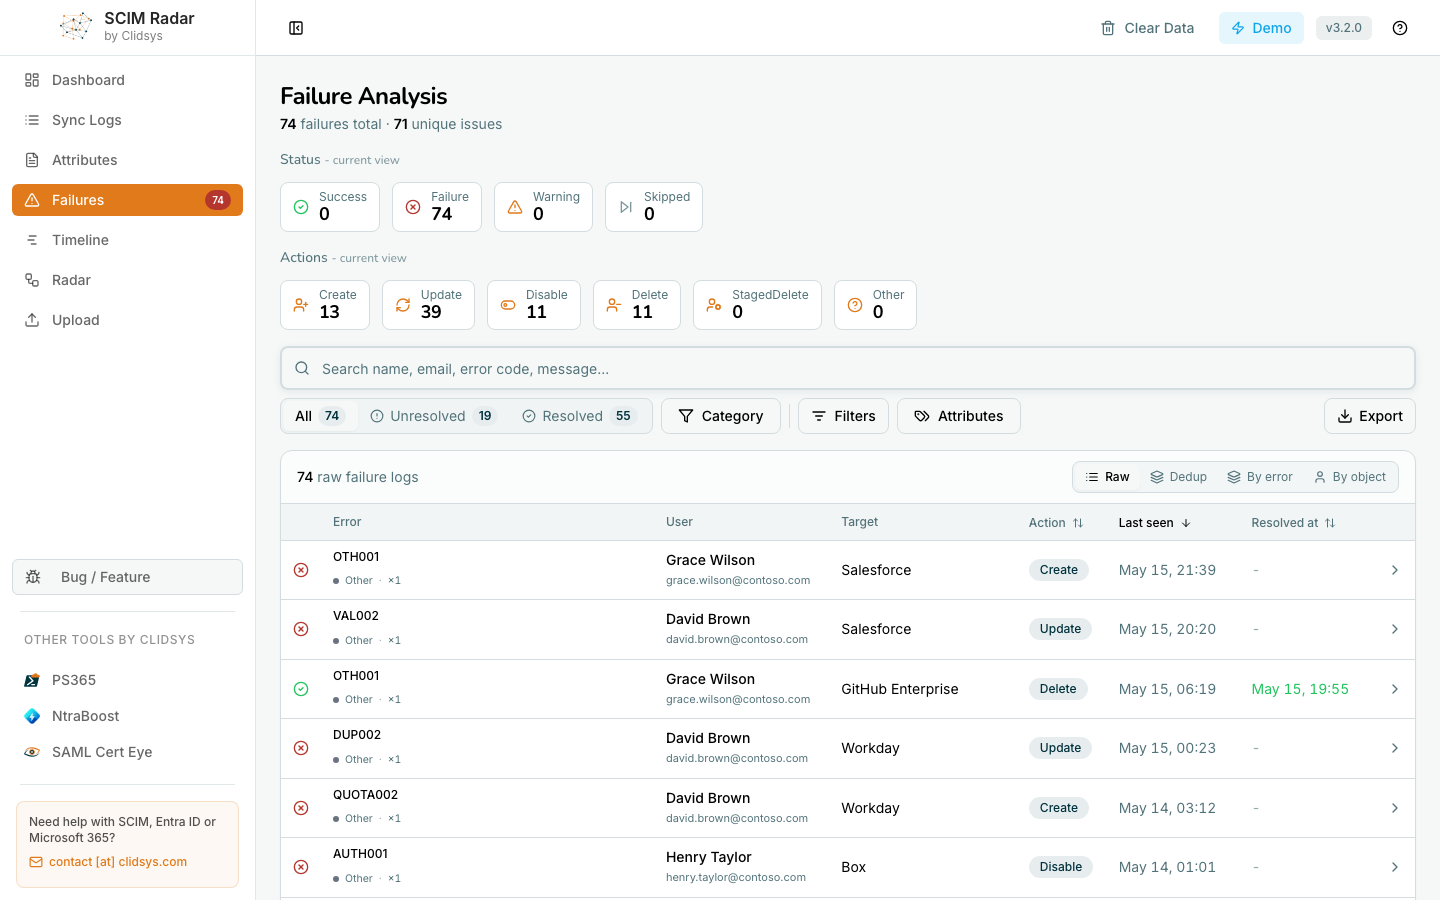
The Failures page surfaces every failed operation, with the option to deduplicate by root cause. The Dedup view clusters failures that share the same error code and canonical message into one row, with a count, last-seen timestamp and the Action the connector tried. When the same error hits thirty users, you triage one row instead of thirty.
Filters across the top:
- Status chips (Success / Failure / Warning / Skipped) with current view counts.
- Actions chips (Create / Update / Disable / Delete / StagedDelete / Other).
- Free-text Search (name, email, error code, message).
- Category, Filters and Attributes modal toggles.
- Unresolved / Resolved tabs to mark known issues as resolved and keep them out of the next review.
Each row drills into a detailed view with the full provisioning step list, retry attempts and the correlation ID Microsoft support will ask for during escalation.
Timeline
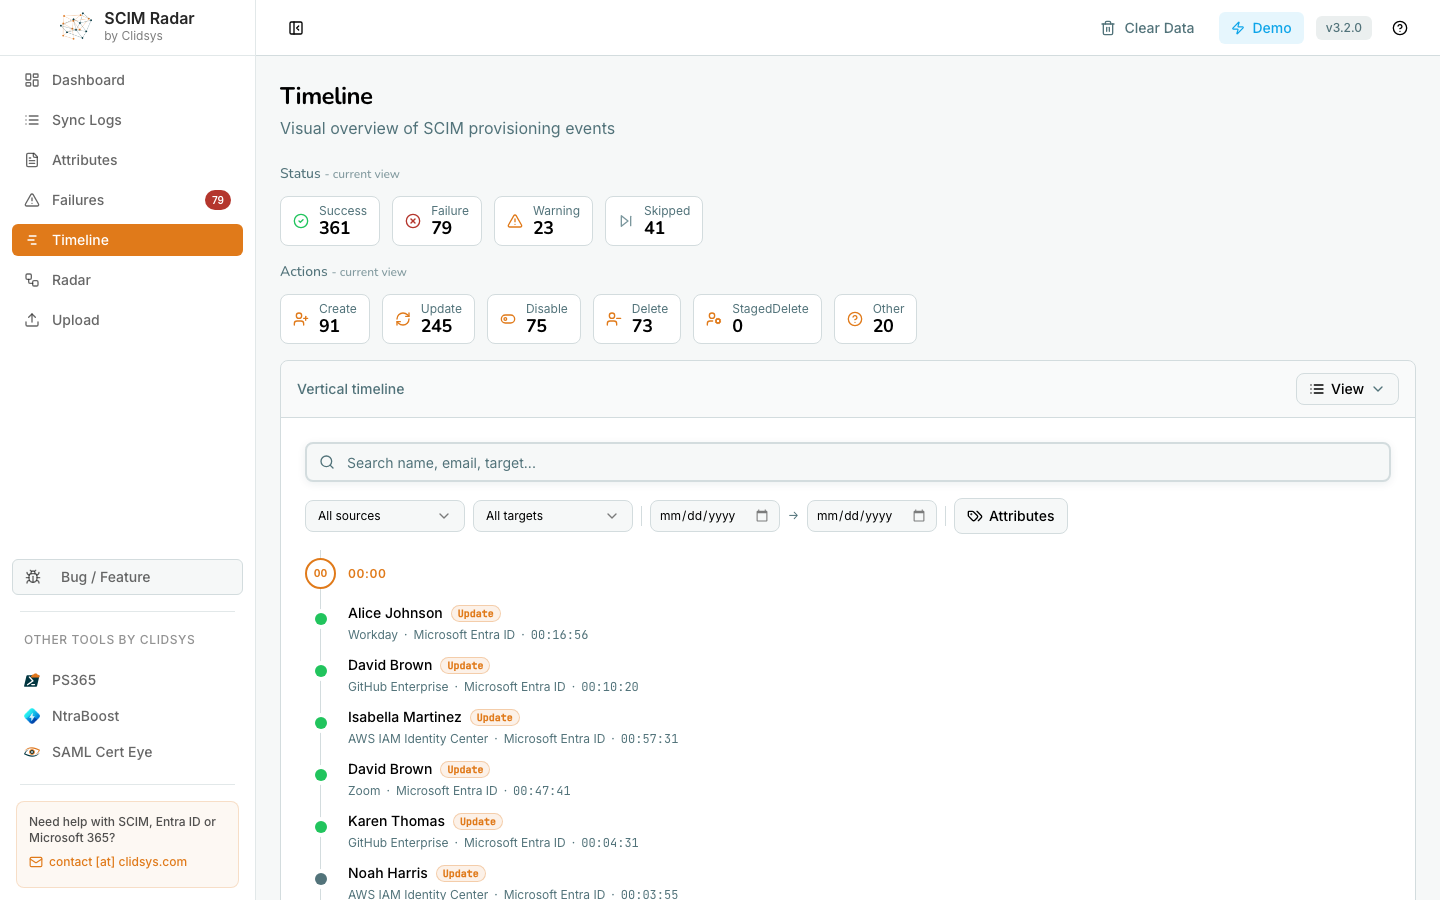
Vertical chronological feed of every provisioning event, filterable by source, target (Salesforce, Workday, GitHub Enterprise, AWS IAM Identity Center, …), date range and attributes. The KPI strip at the top breaks the current view down by Status and by Action.
User Radar
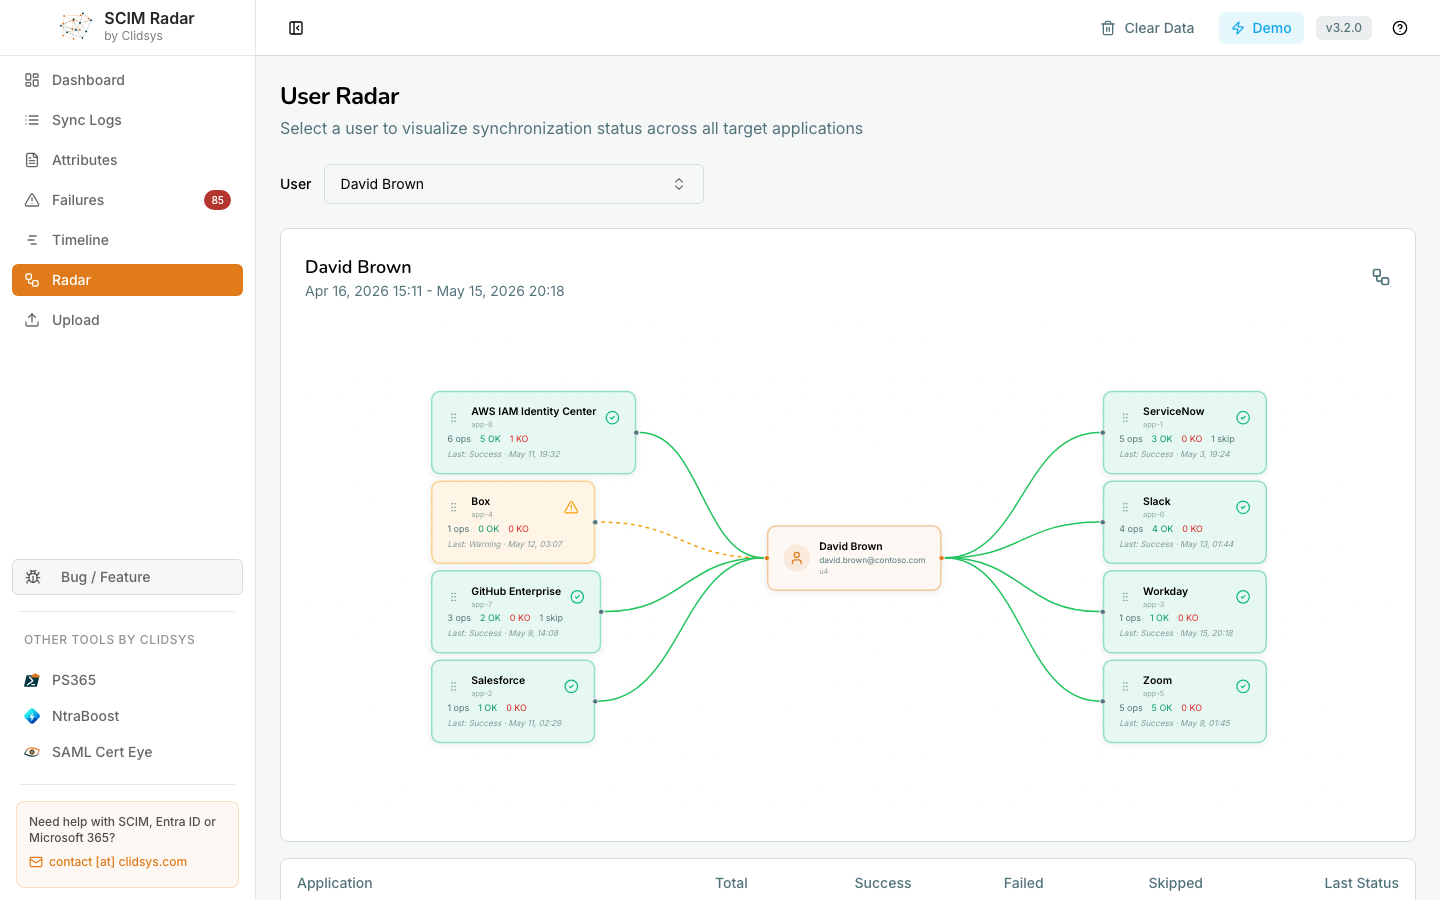
The per-user view. Pick a user and get a hub-and-spoke diagram with the user in the centre and every target application they have been seen on as a spoke. Each spoke shows:
- The count of operations.
- The OK / KO / Skip breakdown.
- The last status and date.
- An edge colour-coded by status (green for success, orange dashed for warning).
Use it when a help-desk ticket says "user X is missing in Y": select the user, read the spoke for Y, and you see immediately whether the last attempt succeeded, was skipped, failed, or never happened.
Loading data
Upload a JSON export
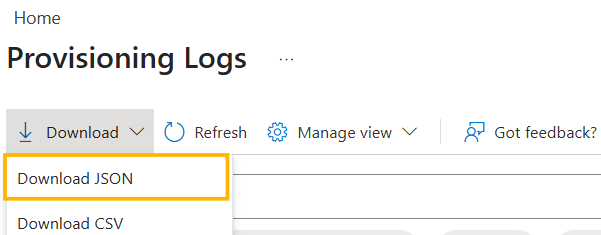
Export the provisioning logs as JSON from the Entra portal and drag-and-drop the file in SCIM Radar.
For a specific SCIM connector:
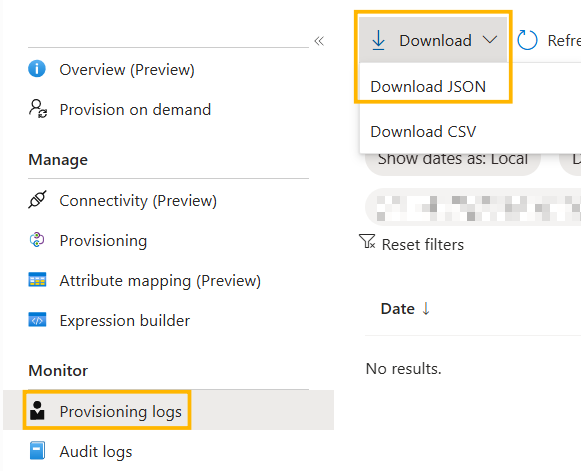
For all applications at once:
Demo mode
Click Try demo data on the upload page to load a representative sample. Useful to walk a colleague through the dashboard or prep a customer demo without production data.
Where your data lives
💡 The JSON file you upload never leaves your browser. SCIM Radar parses it locally and stores it in your browser (IndexedDB). No SCIM Radar server ever receives the provisioning data. Navigating between the Dashboard, Sync Logs, Failures, Timeline, Attributes or Radar views reads from the in-browser store; nothing is uploaded.
Click Clear Data in the toolbar to wipe the store when you are done.
Try it at scimradar.clidsys.com.